- 80 Day RUT Iron Condor - 2013 / 2014 Performance
- Wing Comparison in the 80 Day RUT Iron Condor
- Trade P&L By Day In the 80 Day RUT Iron Condor
- Trade P&L By Day In the 80 Day RUT Iron Condor - Part 2
In this post we will start looking at the same areas for the 66 DTE RUT "no touch" ICs. We will begin by comparing the Summary Statistics of this strategy for the 2013 - 2014 period with the same statistics from the 2007 - 2014 and 2007 - 2012 periods.


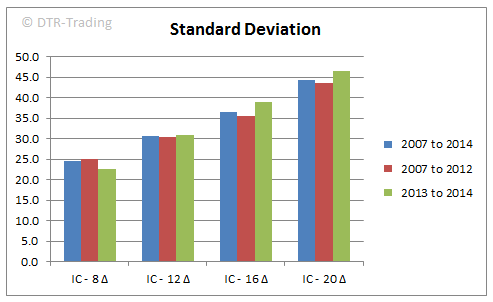
Nearly all of the statistics for the last year and a half are worse than the statistics from the entire test range (2007 - 2014) as well as the prior test range (2007 - 2012). The point is made a bit more clear by looking at all three periods graphically. The bars in green below represent the statistics from the period 2013 - 2014.
We see a negative AGR during the last year and a half from the 66 DTE RUC "no touch" IC, for all delta variations.

We see a smaller "best trade" during this recent period, for all delta variations.

A smaller win rate currently, versus the past.

And a larger standard deviation of returns currently, versus the past (except for the 8 delta variation). The greater the short strike delta, the greater the standard deviation of returns.
We will look at some other aspects of this 66 DTE strategy in the next post.
2 comments:
So thanks for info
You're welcome...thanks for the comment!
Post a Comment