The charts below are organized similar to those in the prior post. Each group of charts corresponds to the short delta listed in the heading bullet (8 delta, 12 delta, 16 delta, 20 delta). Each column corresponds to an IC wing width (column 1 = 25 points, column 2 = 50 points, column 3 = 75 points).
The first row in each group displays the backtest results associated with weekly data, and the second row in each group displays the backtest results associated with monthly expiration data. Weekly data could result in a new trade being initiated every week (if the entry criteria were satisfied), while the monthly expiration data would result in at most one trade per month (if the entry criteria were satisfied). The monthly data does represent a subset of the weekly data, but will more closely match actual trade results for traders who initiate on monthly expirations rather than weekly expirations.
Lastly, trades can overlap...which means there can be multiple trades active at any point in the backtesting. Opening a new trade does not require the prior trade to be closed.
In this post, we'll only review three metrics:
- Normalized P&L per day
- Normalized P&L per trade
- Win rate
Normalized P&L per Day
- 8 delta short strikes (weekly data top, monthly data bottom)
- At 8 delta, the delta neutral structure outperforms the other IC structures.

 |
| (click to enlarge) |
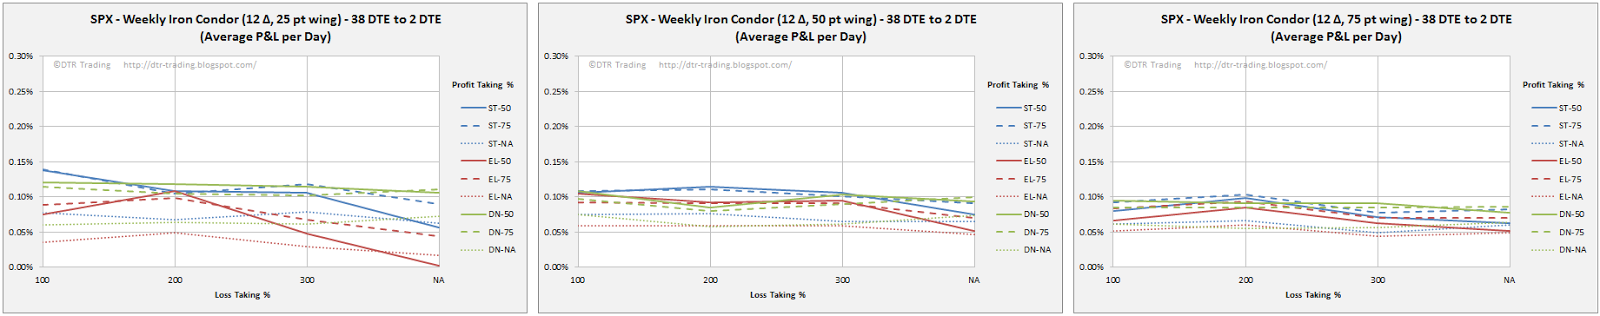
- 12 delta short strikes (weekly data top, monthly data bottom)
- At 12 delta, the 75% profit taking level results in more stable returns as wing width increases. The P&L lines are also more tightly grouped by profit taking level (50, 75, NA) as wing width increases, indicating that profit taking level has a larger impact on P&L than IC structure at this delta.
 |
| (click to enlarge) |
- 16 delta short strikes (weekly data top, monthly data bottom)
- As wing width increases, the P&L per day lines become closer to each other and appear to converge. The 75% profit taking level outperforms the other levels, except for the delta neutral structure. For the delta neutral IC structure, the 50% profit taking level outperforms with 25 point and 50 point wings.

 |
| (click to enlarge) |
- 20 delta short strikes (weekly data top, monthly data bottom)
- At 20 delta, the returns associated with the 50% profit taking level generally outperform the other profit taking levels.

 |
| (click to enlarge) |
The difference between the weekly and monthly results is not large. In general the grouping of the P&L lines in the weekly results is "tighter" than with the monthly results.
Normalized P&L per Trade
- 8 delta short strikes (weekly data top, monthly data bottom)
- In the monthly data, we see that taking the trades to expiration resulted in larger P&L per trade results than either the 50% or 75% profit taking levels. The weekly data, in general, shows the 75% profit taking level narrowly beating taking the trade to expiration.

 |
| (click to enlarge) |
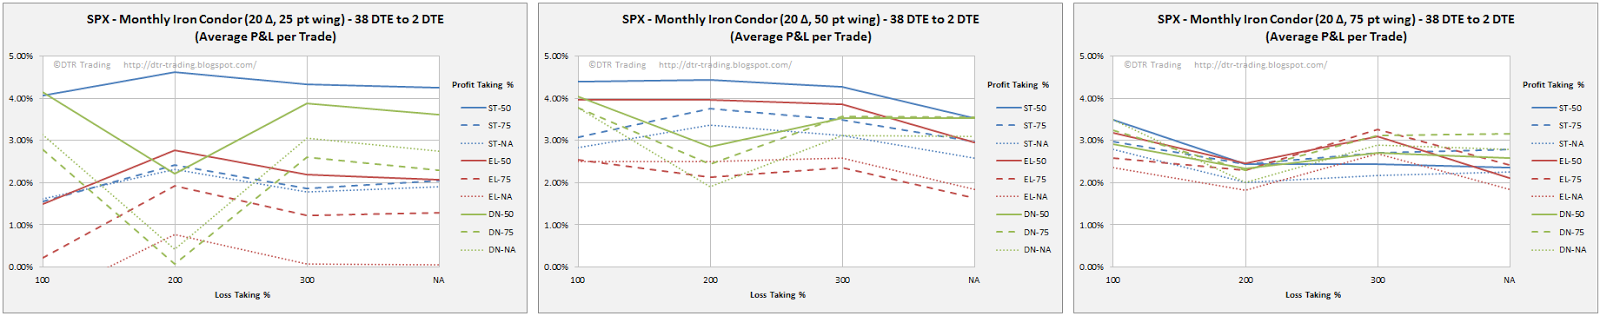
- 12 delta short strikes (weekly data top, monthly data bottom)
- Again, in the monthly data we see that taking the trades to expiration results in greater profits per trade than exiting at the 75% profit taking level. In the weekly data, the 75% profit taking level beats taking the trades to expiration.

 |
| (click to enlarge) |
- 16 delta short strikes (weekly data top, monthly data bottom)
- As the wing widths increase, we see convergence of the P&L lines by profit taking level. The IC structure appears to have less of an impact on returns than the profit taking level...as wing width increases.

 |
| (click to enlarge) |
- 20 delta short strikes (weekly data top, monthly data bottom)
- At 20 delta, the 50% profit taking level outperforms at wing widths of 25 points and 50 points. As we increase the wing width to 75 points, the 75% profit taking level begins to outperform with increasing loss taking levels.

 |
| (click to enlarge) |
The weekly results are again more tightly grouped than the monthly results. The weekly data can result in approximately four times as many trades as the monthly data. This increase in the number of trades in the weekly data reduces the impact of those trades with "extreme" results (both positive and negative).
Win Rate
- 8 delta short strikes (weekly data top, monthly data bottom)
- The 50% profit taking level outperforms the other profit taking levels at 8 delta. The win rate lines appear to be grouped more by profit taking level than by IC structure type.

 |
| (click to enlarge) |
- 12 delta short strikes (weekly data top, monthly data bottom)
- At 12 delta, the 50% profit taking level again outperforms the other profit taking levels. At this delta and 50% profit taking level, the delta neutral structure outperforms the other IC structure types.

 |
| (click to enlarge) |
- 16 delta short strikes (weekly data top, monthly data bottom)
- At 16 delta, win rate grouping by profit taking level is even more pronounced.

 |
| (click to enlarge) |
- 20 delta short strikes (weekly data top, monthly data bottom)
- At 20 delta, the win rate grouping by profit taking level is even stronger. The 50% profit taking level is the clear win rate winner.

 |
| (click to enlarge) |
In general, the win rate lines have a steeper slope from the 100% loss taking level to the 200% loss taking level. The slope tapers off after the 200% loss taking level. When we review the P&L per trade numbers at the 100% loss taking level and 200% loss taking level, in general these P&L per trade numbers decrease as we move from the 100% loss taking level to the 200% loss taking level. Even though the win rate is lower at the 100% loss taking level, the total losses are lower at this level, resulting in a greater P&L per trade value at the 100% loss taking level.
There are several "take-aways" from the results shown in these two articles:
- As short strike deltas are increased, take profits at lower profit taking levels. For example, at 8 delta, take profits at 75%, while at 20 delta, take profits at 50%.
- The extra long put structure generally under performs the delta neutral and standard balanced structures.
- At lower short strike deltas, there is value in using the delta neutral structure. As short strike delta increases, the value in the delta neutral structure decreases.
- At the 50% profit taking level you will generally be out of your trade for a profit between 15 and 20 days. If you haven't hit your profit target in 20 days, you should close your trade.
- The 50% profit taking level has a higher win rate than the other profit taking levels.
- The 100% loss taking level generally has a higher P&L per trade than the 200% and larger loss taking levels.
- The 100% loss taking level generally has a lower win rate than the larger loss taking levels.
Follow my blog by email, RSS feed or Twitter (@DTRTrading). All options are available on the top of the right hand navigation column under the headings "Subscribe To RSS Feed", "Follow By Email", and "Twitter".
2 comments:
Fantastic work. Thank you.
This is great stuff!
Thanks for your efforts.
Post a Comment